Find out why a customer buys and why he does not!
A product can be inexpensive, easy to dispose
and it can be fun to use it. Surprisingly many more
points of contact between customers and products
exist and can be perceived very differently by the
customer.
Sometimes these things are obvious:
A color printer may be almost a gift. But the operating
expenses are high and the environmental acceptability
perhaps a disaster. meineZIELE provides a complex
variety of functions and requires the customers'
reflection. But the gain of productivity is extremely
high, what we know from the feedback of our customers.
Every product has this many points at which the
audience experiences it in different ways.
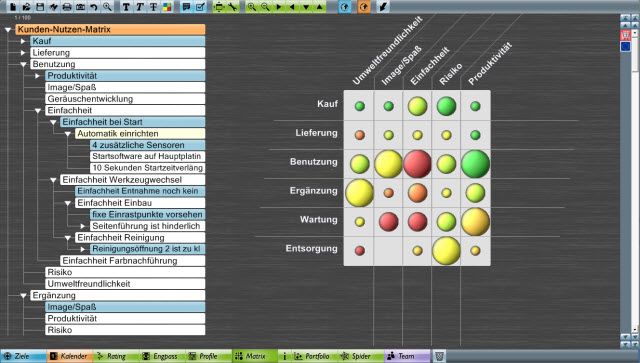
meineZIELE's matrix representation with its
multitude of graphic options shows clearly what
is important to the customer and what is not, what
is good and what is bad. Then it turns out at glance
what one should advertise and what needs to be improved.
To visualize how you are positioned at various
competitive factors on the market, one usually uses
spider diagrams. However, the leadership analysis
or added value analysis should take into account
how important the individual factors of competitiveness
actually are to the customers. This is much more
important than making oneself believe with sham
accuracy how many percent each product is better
or worse than the respective competitive product.
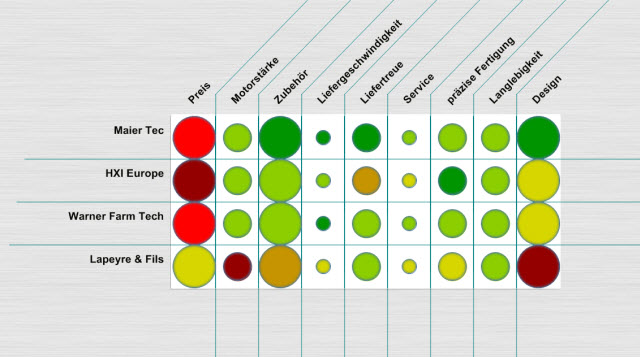
In this case we can see the advantages of a "traffic
lights matrix":
The red color shows where
you are worse than the respective competitors, green,
where you are better and the shades between red
and green represent grades. Small dots represent
few decisive and large dots important purchase arguments
of the customers. You see at glance where you lead
and where not.
Tip:
If you are employee, do also create such a matrix or at least a simple profile for your "product" performance and your "customer" employer. How is your performance, further education, interaction perceived by your supervisors, colleagues and your team?


