Paul is shocked by the utility bill. He wants to save electricity.
What he wants to do is a typical "improvement program" with as many improvements
as possible in different places. Paul takes stock first. He walks through the
house in his mind and puts all the energy consumers together. You can't do that
in your head. But with meineZIELE you get a thorough overview.
This example shows what that looks like.
Paul uses the file template
The example is opened from the program: Menu Knowhow >
Examples > Goals > Save energy.
What is there to learn?
You will learn,
how to use numeric extra columns
how to calculate totals and subtotals
how to get a cross-sectional view
Let's see how he does it:
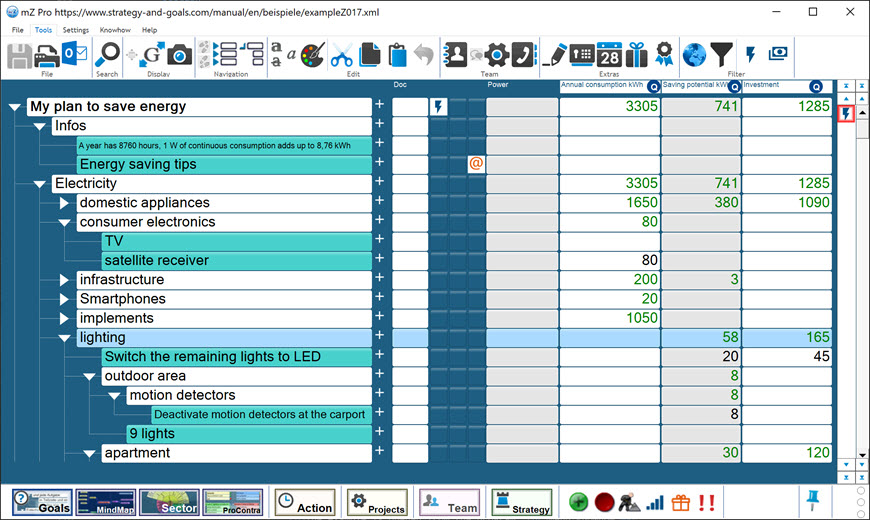
The extra columns
Of course, Paul wants to know which are the big power guzzlers. From the
electricity bill, he only knows the total consumption. He estimates the
consumption of the old freezer according to information from the Internet.
Others he can calculate exactly, like the motion detectors, which consume their
6 watts uninterruptedly year in, year out.
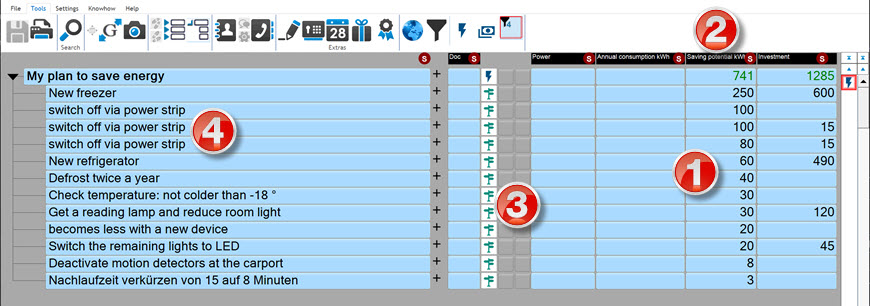
In short, Paul determines the annual consumption in kWh for his devices, he
estimates the savings potential in each case, also in kWh, and he estimates what
he has to invest in each case for these savings. In the end, his estimate and
the invoice from the municipal utility should match.
meineZIELE provides extra columns for any use for such purposes. There are four of them for
text strings, as in the book list example, and another four for numbers. (Customizing the field
names: In the details of any entry for all rows at once)
Calculate sums
Normally nothing needs to be done for summing up, unless "Sum up budget fields
automatically" was switched off in Options / Projects / Budget, see
instructions. The tree structure is already taken into account during summation
and corresponding subtotals are formed. This works automatically.
How to sort
After all the trouble, Paul now wants a list sorted by savings potential. But he
has a tree structure in front of him. There are subheadings and the numbers are
also at different levels of detail. All those subheadings should be excluded from the list. But how to
sort something like that?
Quite simply: This is exactly what the "cross-section" view does. You can create
cross-sections yourself (via the selection filter, see also the cross-section
example). Or you can use the "quick cross-section" that meineZIELE automatically
offers as soon as it suspects that something like this might be intentional,
i.e. if some numerical values have been entered in the budget or the numerical extra columns.
The program then displays an cross-section button for all
columns that are suitable for this:
Here in the example, two of these cross sections are created as fixed filters
for comparison, as one would do in more complicated cases. In
practice, of course, you only need one of the two solutions.
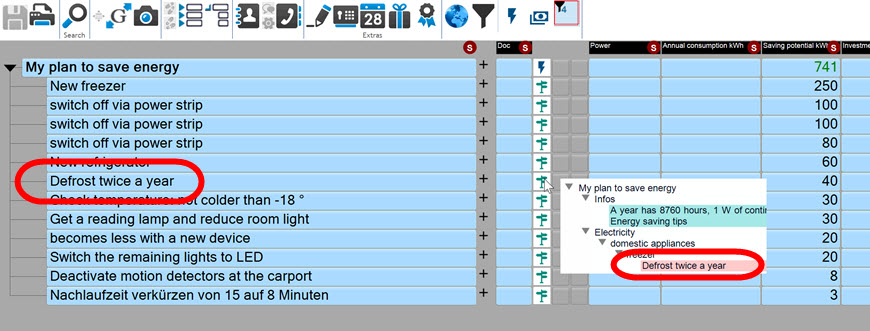
The cross-section listing
Here's what the result looks like when Paul clicks the Q icon on his Savings
Potential column:
There are only rows left, for which a savings potential has been recorded. All
rows are
moved to the same level and the list is sorted. The Q symbol
is now gone and the sort symbol can be seen in several columns. Paul
could
also sort in the opposite direction with one click, or perhaps alphabetically,
if he wanted.
Paul gets a little annoyed when he discovers that there are now a couple of
exactly the same measures in the list that he can't tell
apart. But then he
discovers a new signpost icon that can be seen in every row. This is
exactly
what is intended for such cases. Lines that are picked from
somewhere in a tree-like outline often don't make sense on their own. If you now
move the mouse over the signpost icon, the necessary structure information is
displayed as an outline, just like meineZIELE does in the "Action" view.
Now Paul can begin. One after the other, starting with the largest chunks. Always
first things first.
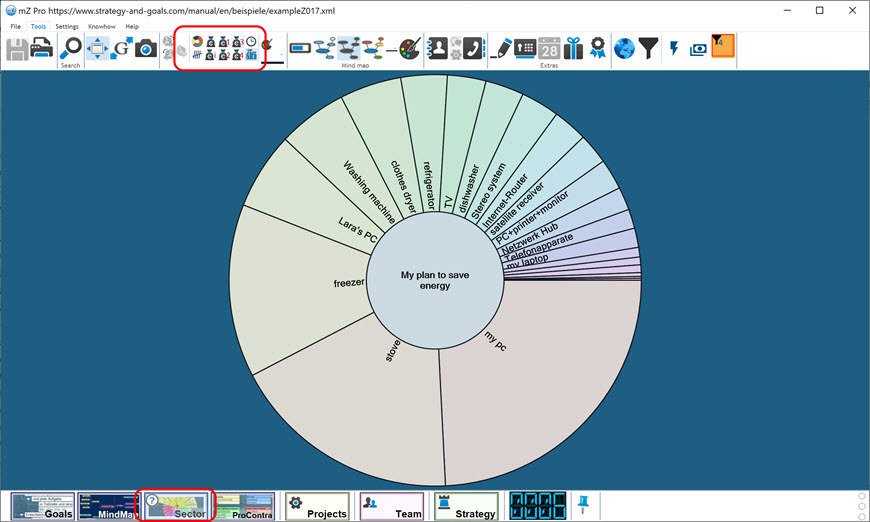
How to get a diagram
Paul is happy to have discovered right away something he prefers to have: The
sector map view also works
when a cross-section is selected.Paul chooses the weighting according to extra
column 2, in which he has entered the consumption. He gets his estimated power
consumption sorted by size as a pie chart:
You can simply leave the quick cross-section with the escape key. "Advanced
cross-sections", which in case you have created as a filter, can be left just by deselecting
the filter.

 for all
columns that are suitable for this:
for all
columns that are suitable for this: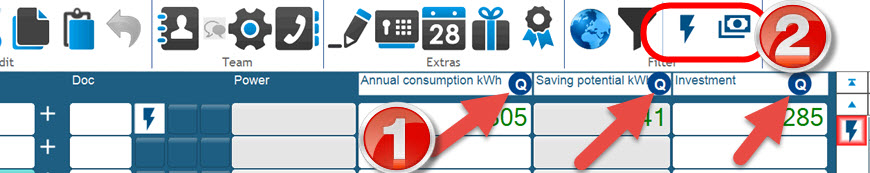
 for comparison, as one would do in more complicated cases. In
practice, of course, you only need one of the two solutions.
for comparison, as one would do in more complicated cases. In
practice, of course, you only need one of the two solutions.
 The Q symbol
is now gone and the sort symbol can be seen in several columns.
The Q symbol
is now gone and the sort symbol can be seen in several columns.  Paul
could
also sort in the opposite direction with one click, or perhaps alphabetically,
if he wanted.
Paul
could
also sort in the opposite direction with one click, or perhaps alphabetically,
if he wanted.
 that he can't tell
apart. But then he
discovers a new signpost icon
that he can't tell
apart. But then he
discovers a new signpost icon  that can be seen in every row. This is
exactly
what is intended for such cases. Lines that are picked from
somewhere in a tree-like outline often don't make sense on their own. If you now
move the mouse over the signpost icon, the necessary structure information is
displayed as an outline, just like meineZIELE does in the "Action" view.
that can be seen in every row. This is
exactly
what is intended for such cases. Lines that are picked from
somewhere in a tree-like outline often don't make sense on their own. If you now
move the mouse over the signpost icon, the necessary structure information is
displayed as an outline, just like meineZIELE does in the "Action" view.