The pivot view is part of the rubric "Team". (You can also
reach it on F12 while using Quick
mode.)
What is the Pivot view?
This view gives you a new perspective on e.g. a protocol. You
might know pivot from excel. In meineZIELE the starting point is
not a schedule but the outline. And we are not dealing with
numbers but with tasks. So it looks different of course. Here an
example:
Example:
You find an example to download in the program in the Menu
"Examples" > Team.
Sara Wirth takes part in a meeting of a committee. She is
using her notebook and meineZIELE to record and create a
protocol. There are three topics to be discussed. Inputs, facts
and tasks are subordinated as an outline. Thats why meineZIELE
is perfect for making a outline protocol.
Sara is using the Goals view of meineZIELE for her protocol. She develops an outline (1) with additional columns for "From whom?" ( = Who brought the input?) and "Who?" ( = Who is responsable for the task?) (2). She also puts icons for some extra information.
Sara knows from her experience: In the end of the meeting the members don`t only want an objective outline of the discussed topics but also ask questions like "Who made this contribution?", "Who will do this task?", "Which tasks did concern financial issues? Or environment? Or staff? ..."
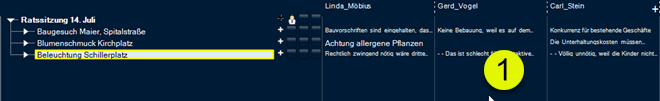
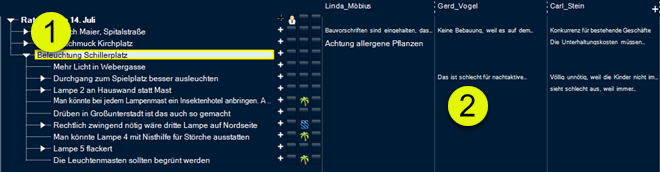
That means Sara`s protocoll should look like this. This is the same file in the pivot view (4). At marker (5) you find the topics from the outline. At (6) you find the subitems from the outline in colums. In the current case they are sorted by people (7) . The content of the list shows who said what during the discussion (content of the column "From whom?" (8).
On this screenshot you see another layout. Now the columns show the contriburtions that have been marked by icons (chosen by button (9)). In this way Sara gets a list of entries that concern law (10), environment (11) and tourism (12).
Sara is the one who is choosing the icons and what they
represent in her context. meineZIELE uses all the icons that
have been used and makes columns out of it. It is the same with
persons and the other information like "Equipment" for which
this Pivot view is usable.
Where does the information come from?
In meineZIELE each entry line of the outline can contain such information (e.g. as an icon or in the columnt "Who?" for the responsible person etc). This is called "tagging". The lines of our outline are being tagged with an additional information (e.g. by an icon that means: "Concerning environment" or something like that).
If you are planning to collect a lot of information you
should plan your action. Sara is also following an important
tip: She is using the quick mode
for fast entry.
How to reach the Pivot view:
The Pivot view is part of the Team section. There you can use
the icons to change from one perspective to another:
Meaning of the Pivot buttons:
![]()
![]() "Who?"
: The content of the column "Who?" is divided into new
columns: There is one column for each person that has at least
one task to do. All tasks of one person concerning one topic are
displayed together in one cell of the list.
"Who?"
: The content of the column "Who?" is divided into new
columns: There is one column for each person that has at least
one task to do. All tasks of one person concerning one topic are
displayed together in one cell of the list.
![]() "With
whom?" : Like in in the column "Who?", here with
the assiting persons.
"With
whom?" : Like in in the column "Who?", here with
the assiting persons.
![]() "Who?
+ "With whom?" : Here the
content of two columns is mixed. All the people are listed, no
matter if they are responsible for the task or only assisting.
"Who?
+ "With whom?" : Here the
content of two columns is mixed. All the people are listed, no
matter if they are responsible for the task or only assisting.
![]() "From
whom?" : This column is normally used for people who
ordered the task. In the context of a protocol for a meeting it
can be used for the person who made a contriburtion.
"From
whom?" : This column is normally used for people who
ordered the task. In the context of a protocol for a meeting it
can be used for the person who made a contriburtion.
![]() "For
whom?" : People from the column "For whom?" These are
the people for whom the task is done. This can be clients or a
software user who reported a bug..
"For
whom?" : People from the column "For whom?" These are
the people for whom the task is done. This can be clients or a
software user who reported a bug..
![]() Status
: Each used status gets his own column. This can be
used for questions like "Which tasks have to be controlled?" or
"Which tasks are wating for being signed?" ...
Status
: Each used status gets his own column. This can be
used for questions like "Which tasks have to be controlled?" or
"Which tasks are wating for being signed?" ...
![]() Equipment
: Each used equipment gets a column. This can be used
to get a quick survey of which construction machine or which
vehicle are scheduled for which task.
Equipment
: Each used equipment gets a column. This can be used
to get a quick survey of which construction machine or which
vehicle are scheduled for which task.
![]() Icons
: See example above.
Icons
: See example above.
![]() ,
,
![]() ,
,
![]() ,
,
![]() Field
1 - 4 : F There are 4 free fields available for special
applications.
Field
1 - 4 : F There are 4 free fields available for special
applications.
![]() Date
1 : Planned dates
Date
1 : Planned dates
![]() Date 2:
Date end
Date 2:
Date end
meineZIELE displays only the buttons for the content
that has been jused. If for example no status has been
jused, pivot concerning status does`t make sense. So the
status button is invisible.
Tip: Zoom
Back to our example:
meineZIELE normally opens the pivot view in the zoomed view
(if there is enough space). But of course it can also look like
this, because the program cannot always know which topics you
want to see):
To be able to read texts with several lines you choose now
which topics you want to see by using a selection frame (1)
(click at the left side of the triangles, hold and pull, let
go).
The selected topics are marked yellow now. Then you click on the
Zoom button (2). Now meineZIELE uses the complete display area
for the chosen topics.
Tip: Marking invisible
In the zoomed view the marking of the currently selected line
(3) is very striking. This can be useful. If it´s not you can
turn it off. In all outline views this is done by using the key
F8 (also to turn it on again). In the zommed view there is also
a button for it (4) because it is needed more often here):
Tip: Columns
The installation of the columns (5) is done automatically of
course and the column group is not a kept permanently. On short
notice it is anaway possible to change the column group (to
change the order or size of the columns) by pulling by mouse or
by using the column window (click on + in right upper corner of
title line). It is also possible to exclude columns from being
displayed.
If there are too many columns it is possible to scroll
horizontally (6).
Drill down
Now the moment has come that sara was expecting. When she
shows the protocol in the end on a screen, there are statements
somebody cannot remember. The team member Gerd Vogel questions
his statement (1):
So Sara opens the topic (1) . Gerd Vogel`s statement is still
visible in his column ("Gerd_Vogel") (2). But now you see that
was made in a subcontext.
Sara opens another level of entries (1):
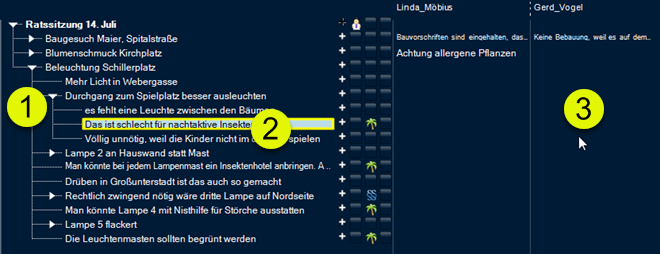
Now the statement is displayed in the outline on the left (2) as it was integrated before. Thats why it is no longer visible at (3) . The Pivot view only gives a new perspective, the ouline stays the same.
Now Gerd Vogel can remember what he said and Sara gets applaus
for her great survey.


